 Cheqq
CheqqSlides that arrive finished.
Not an outline you still have to build. Every slide gets the layout its point deserves, charts arrive as real chart objects, and the file opens anywhere.

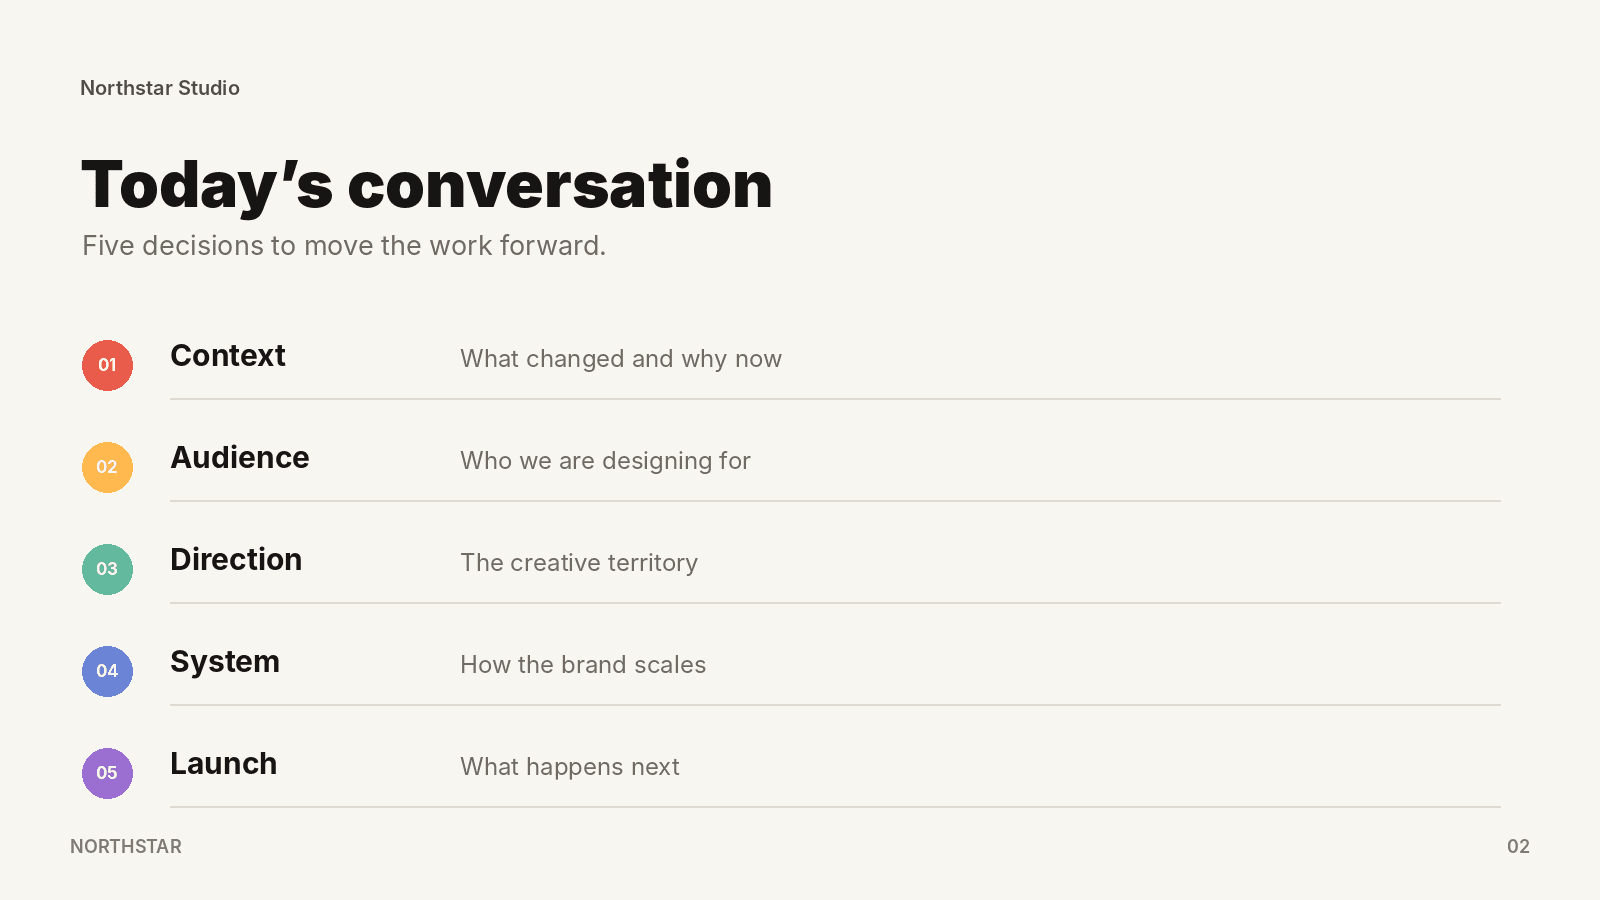
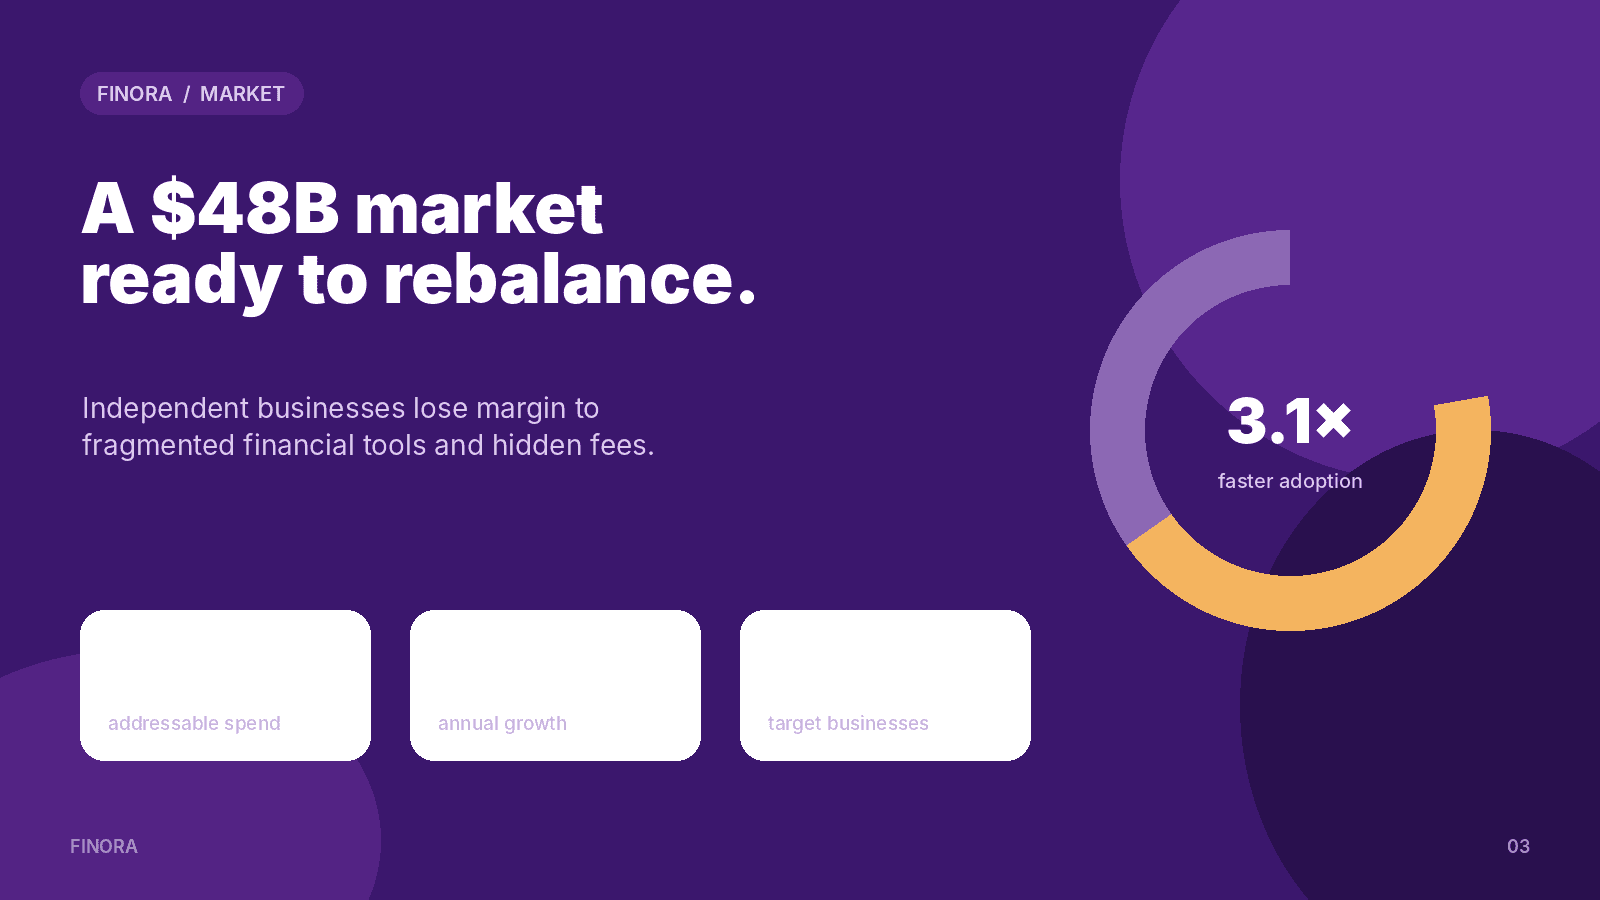
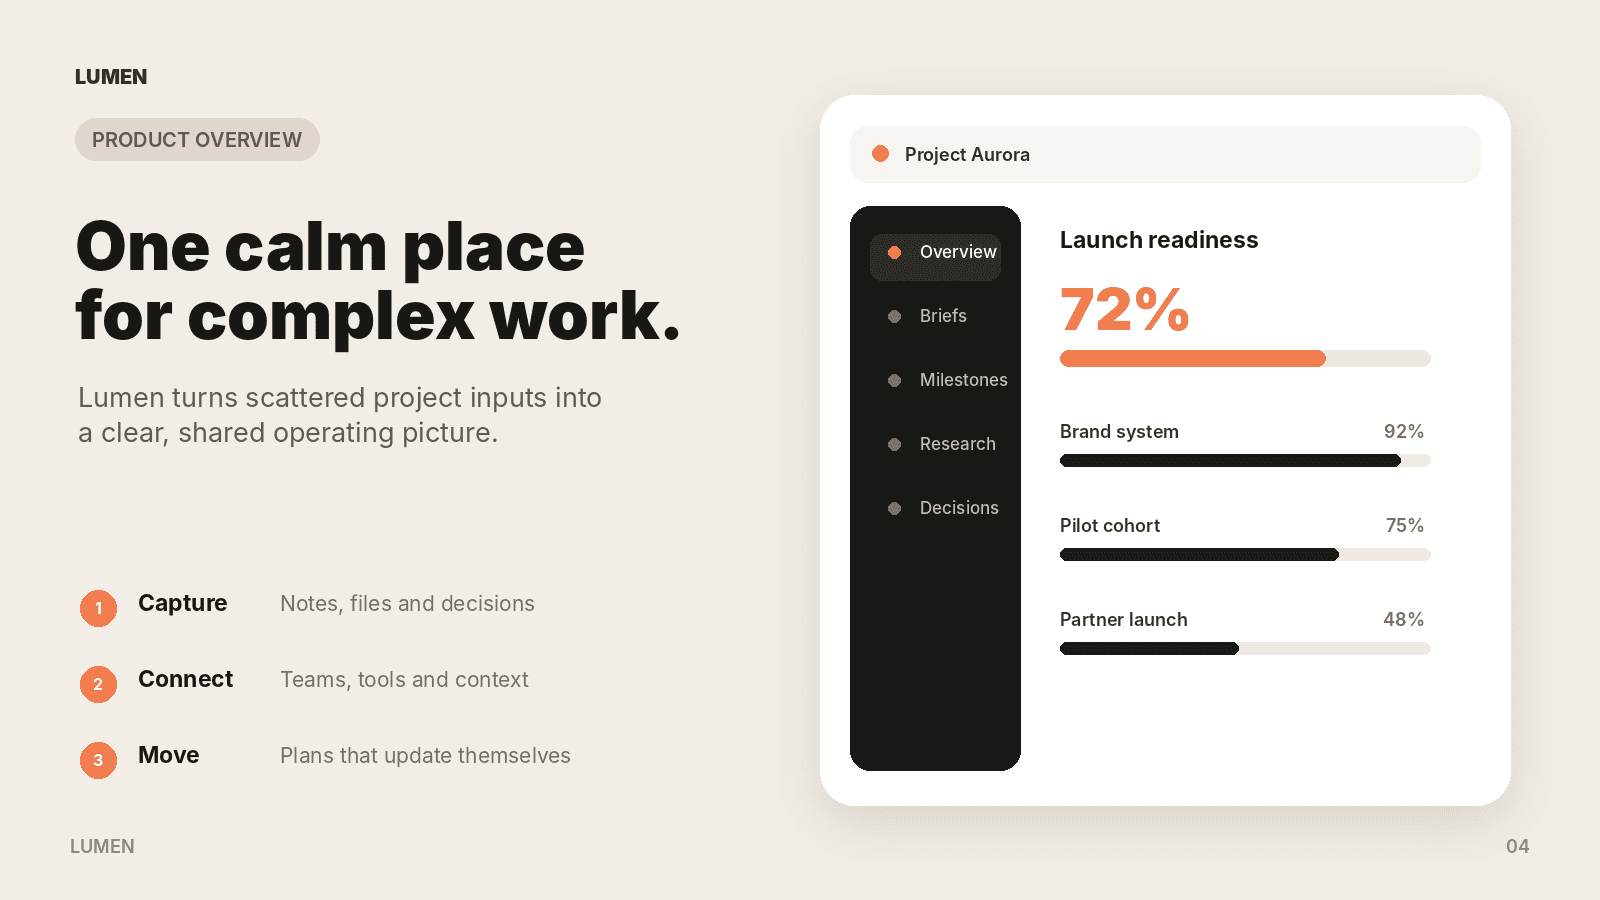
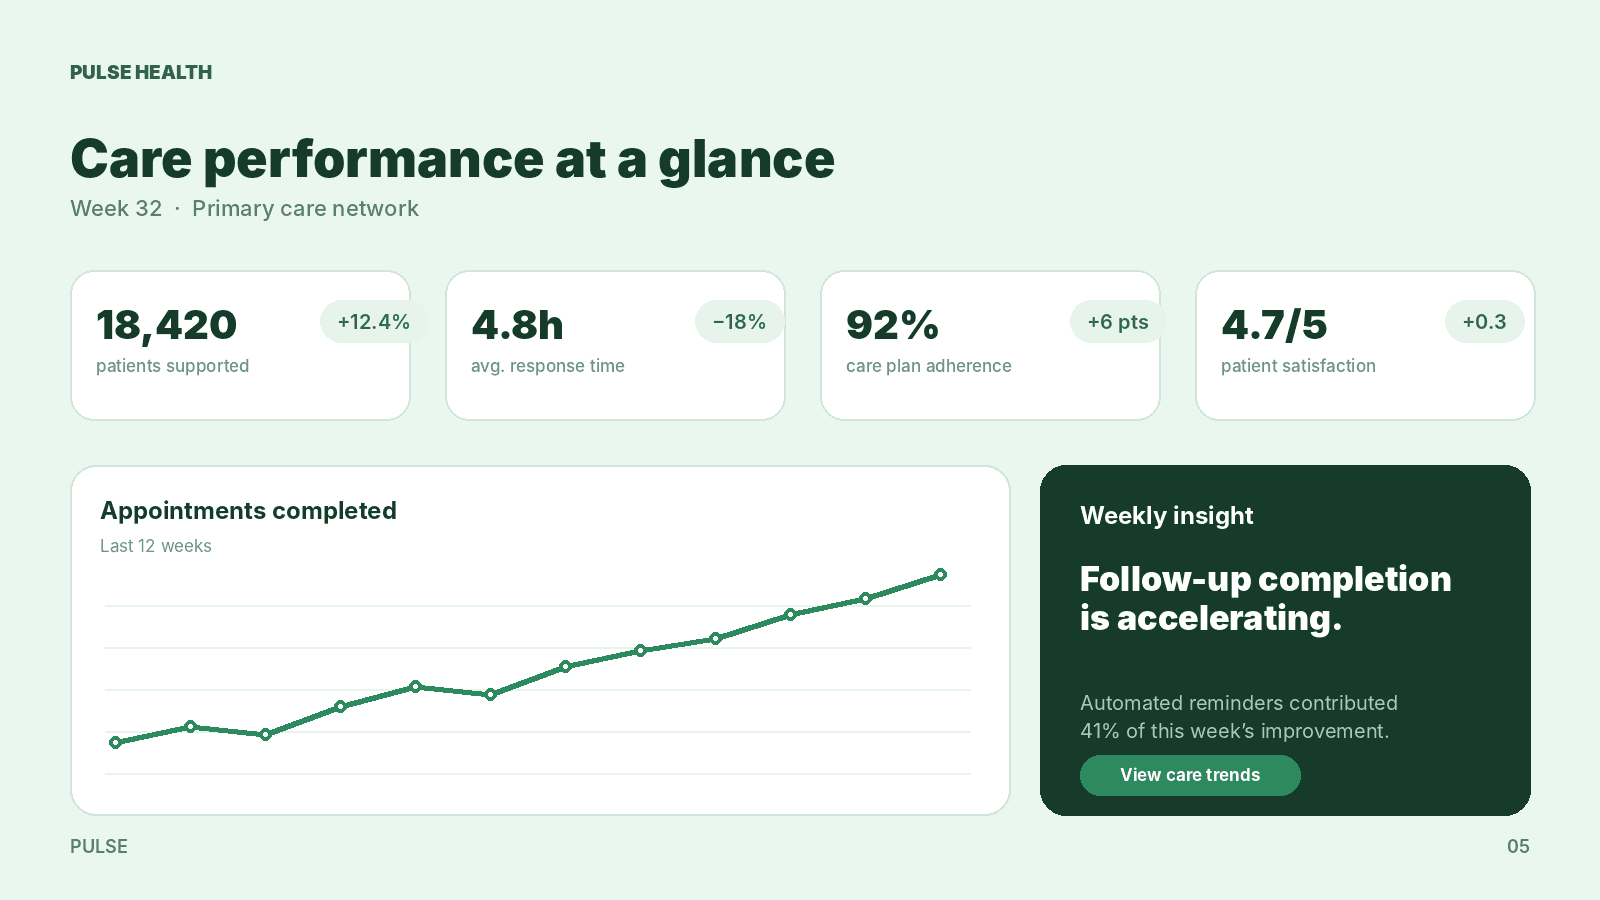
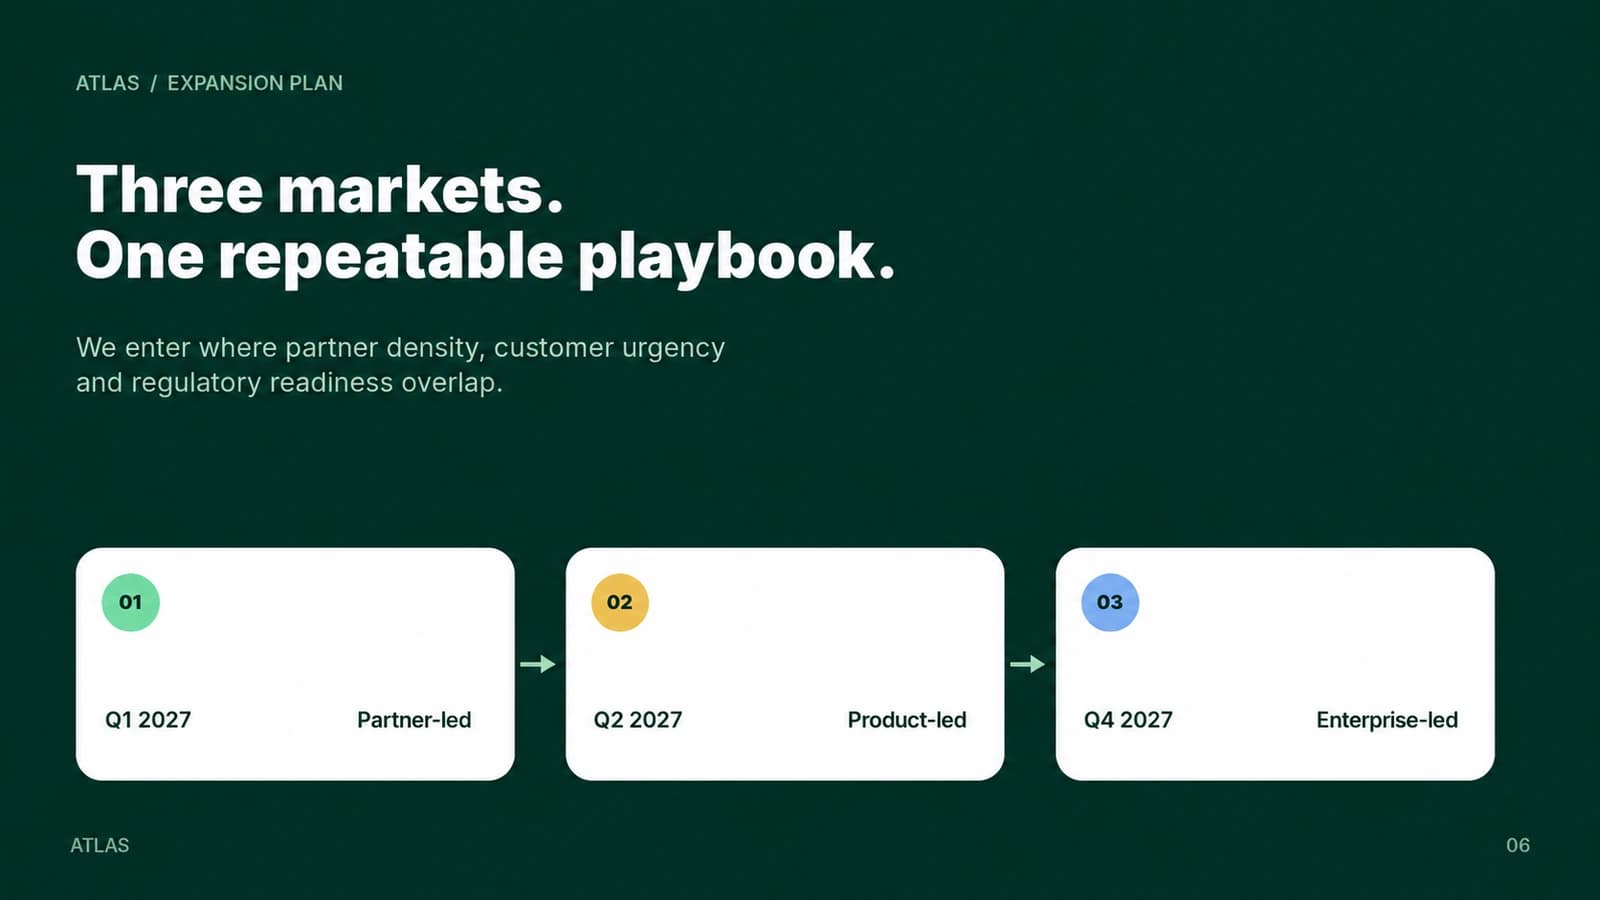
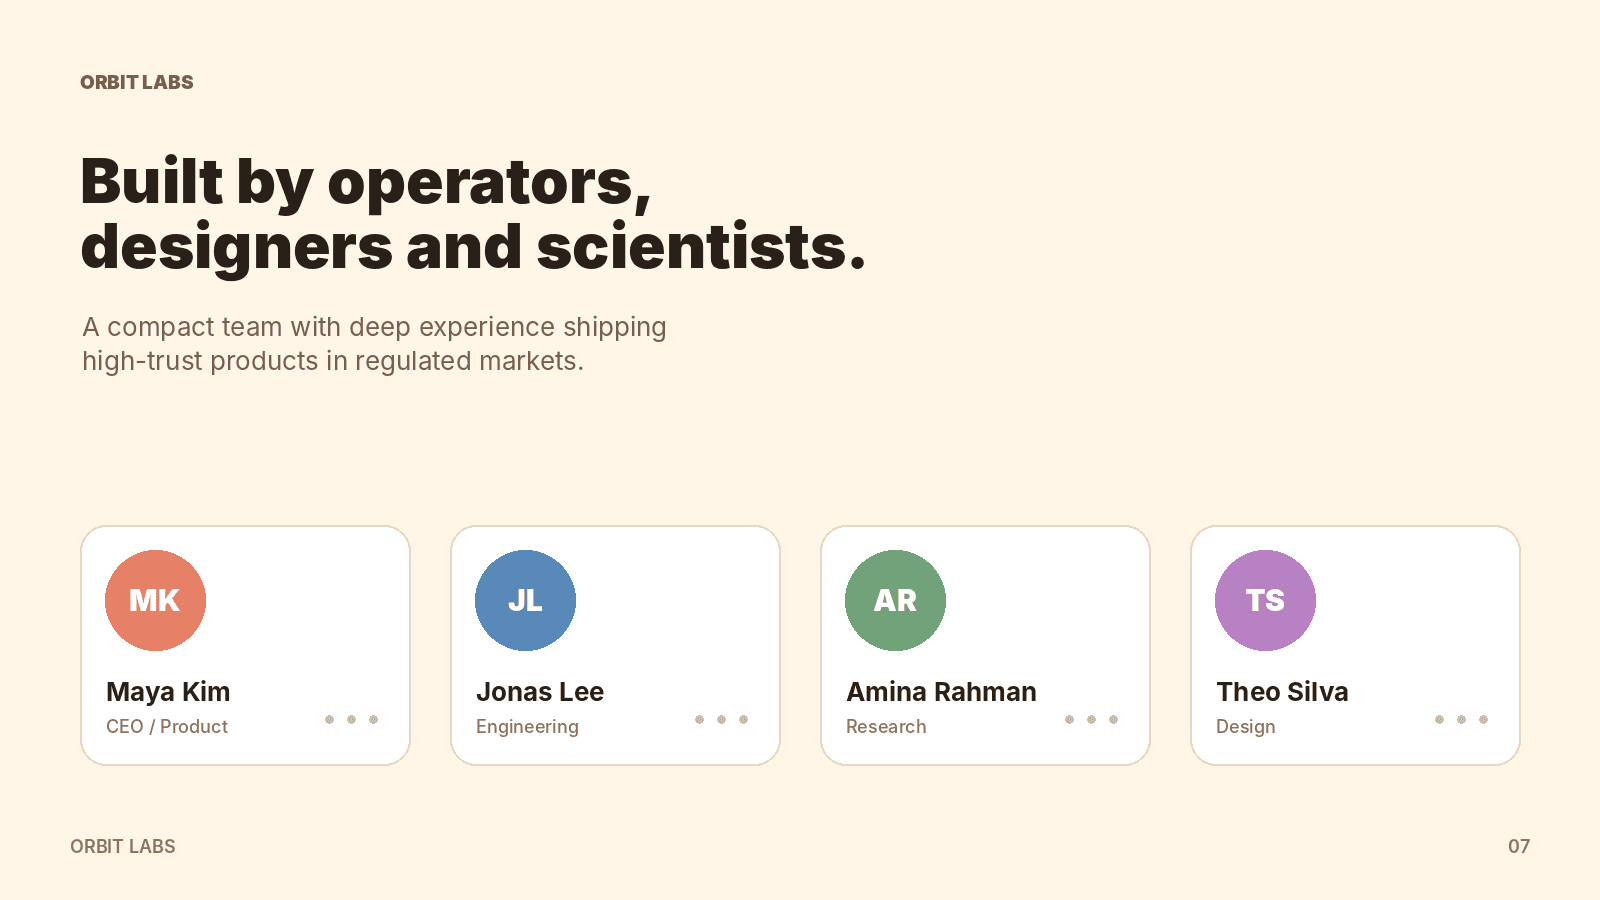
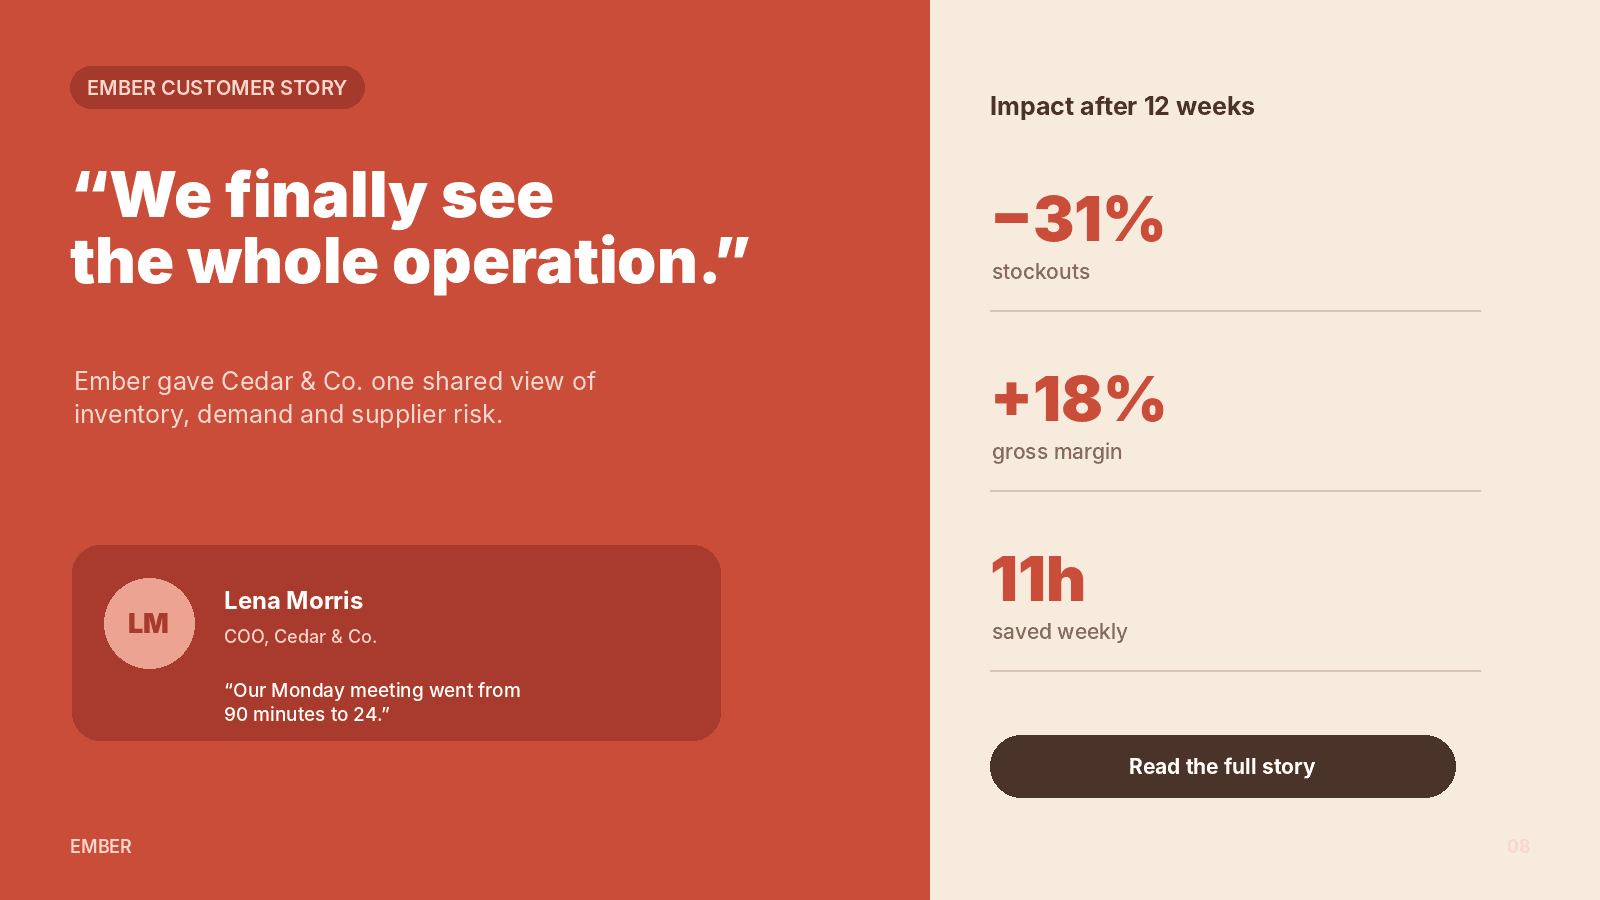
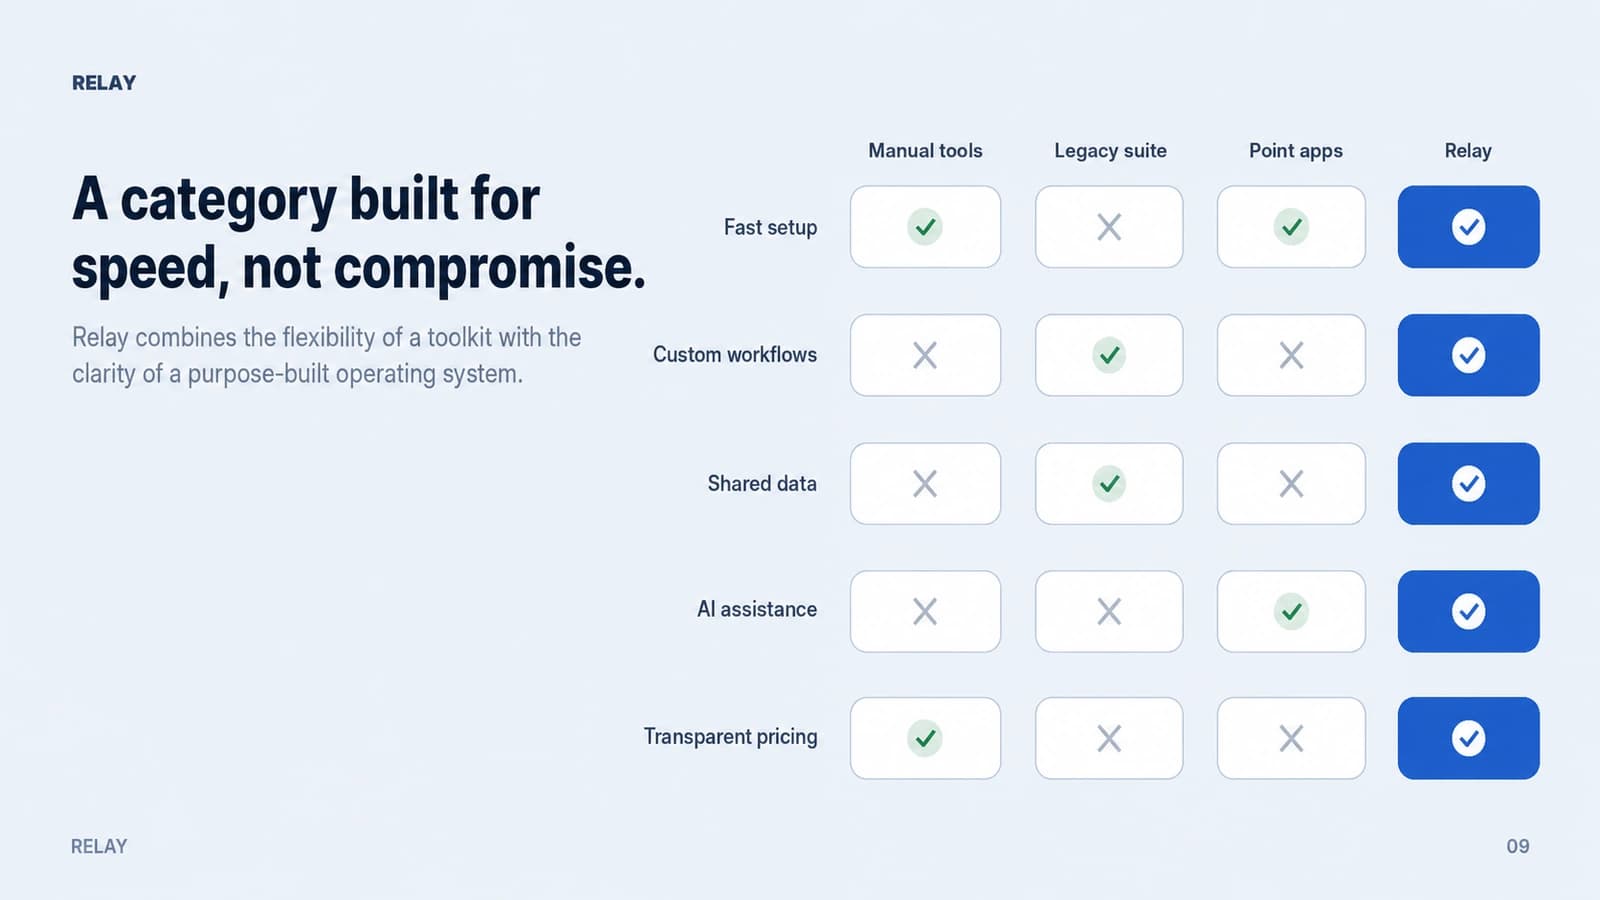
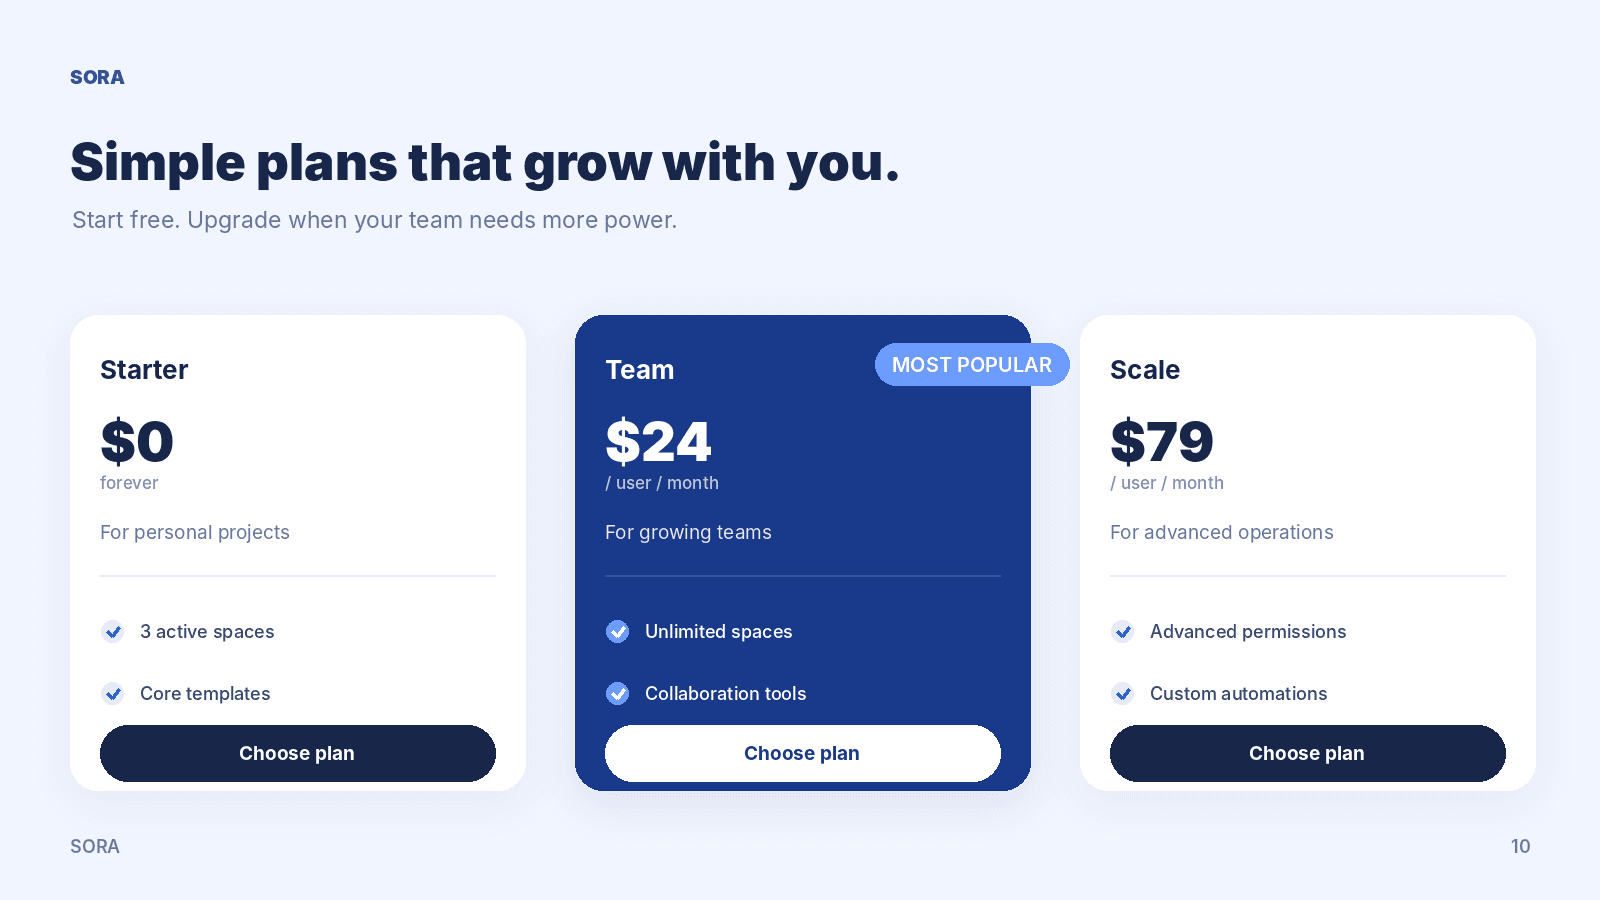
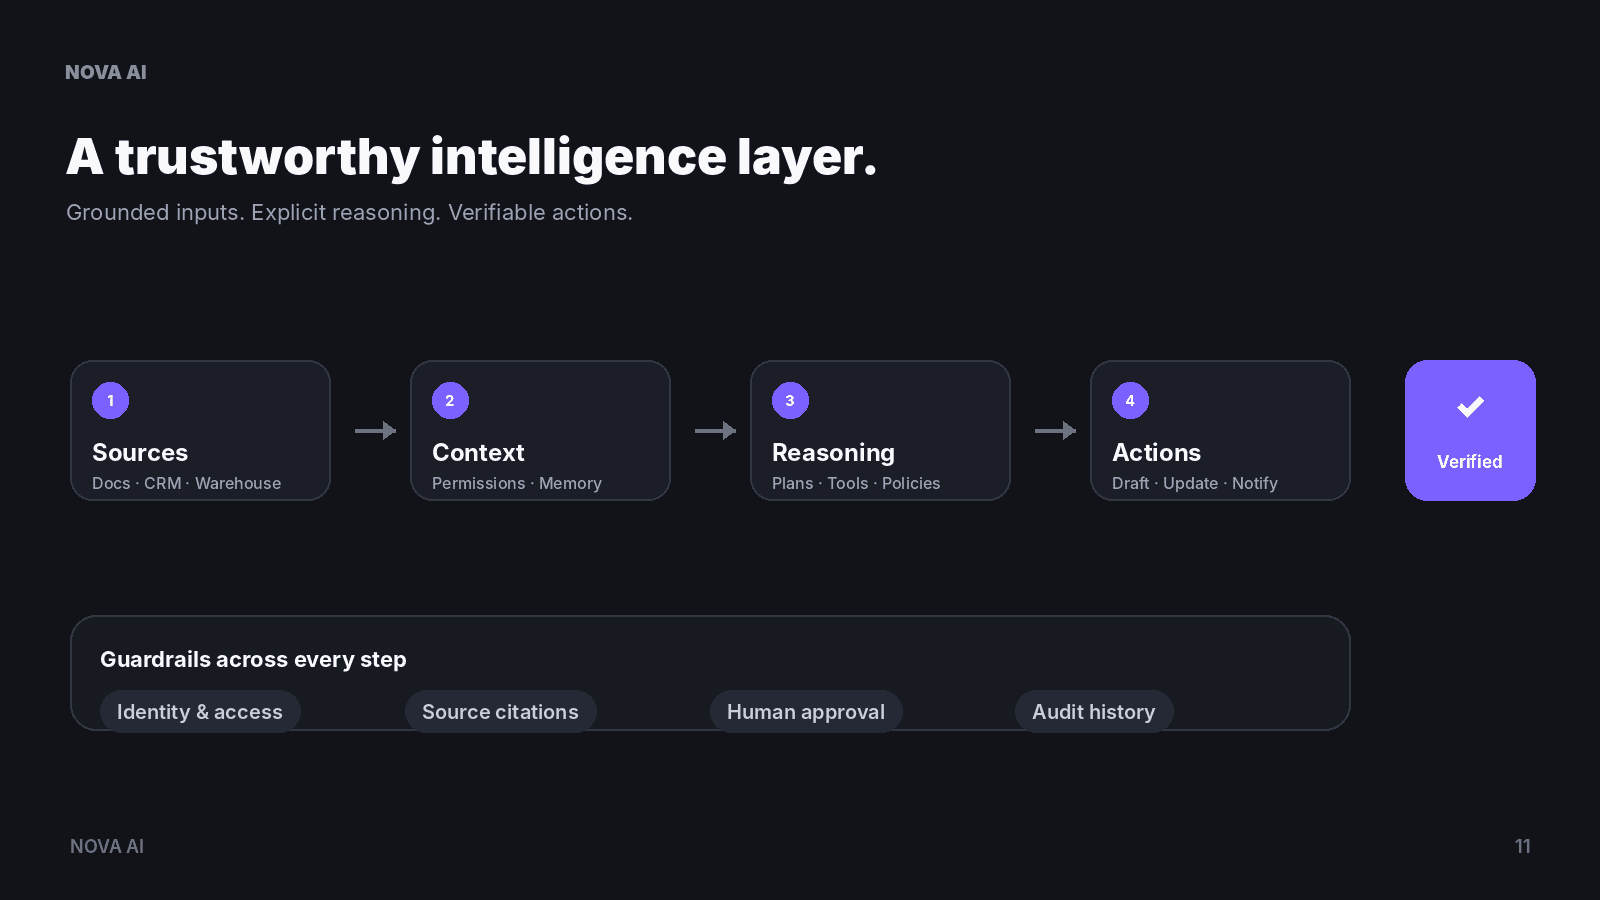
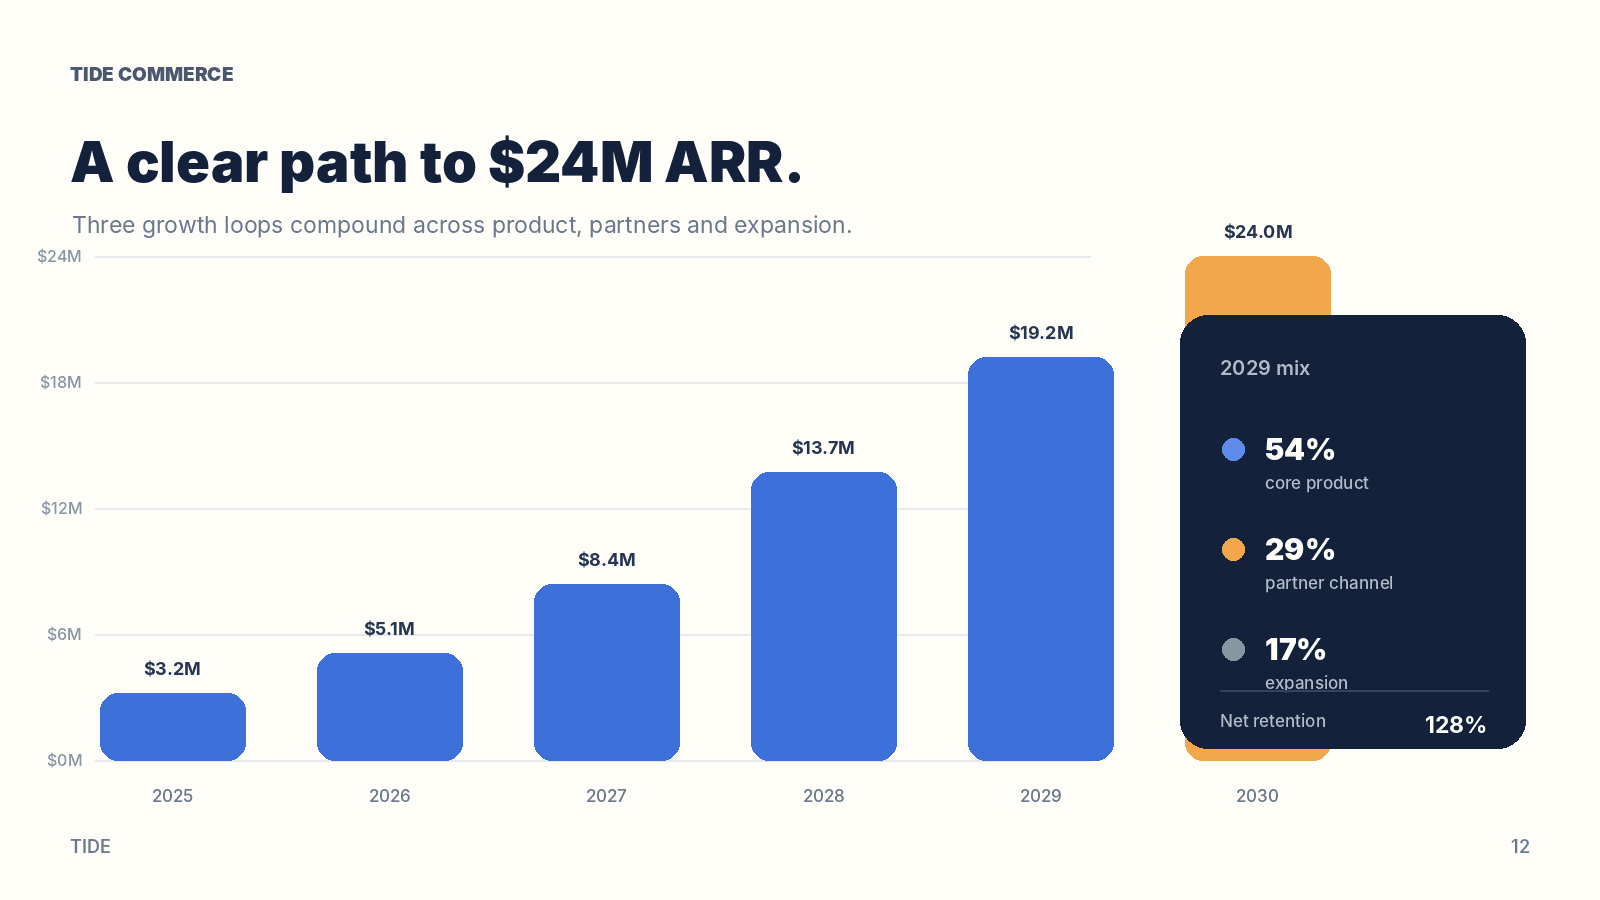
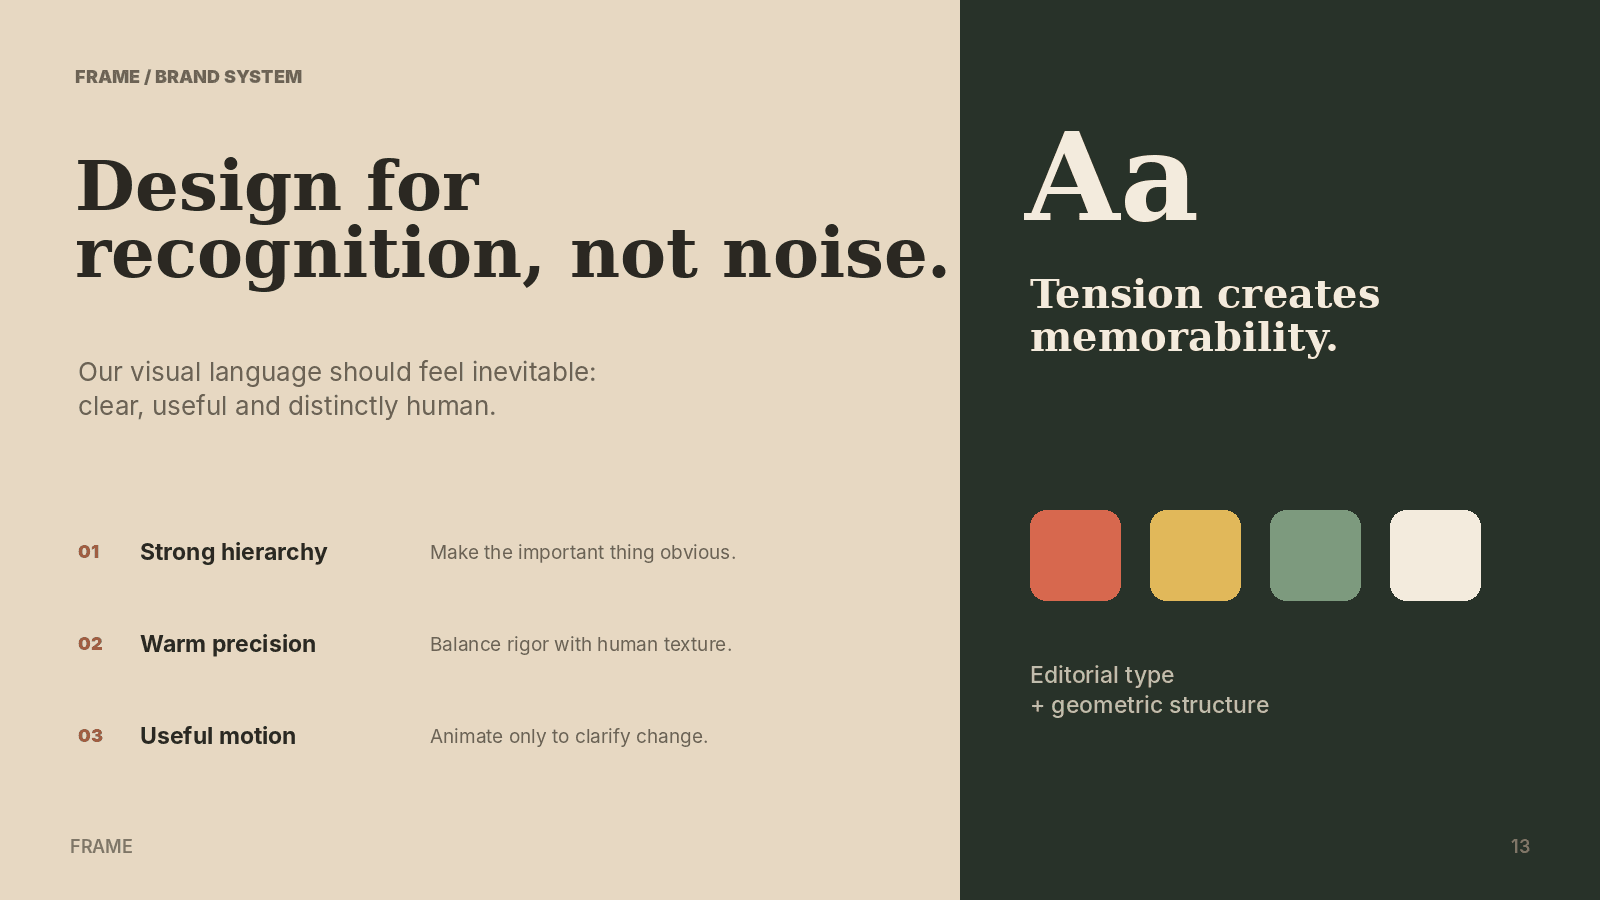

- A deck, not an outline
- ready to present
- Charts you can still edit
- real objects, not screenshots
- Opens anywhere
- PowerPoint, Keynote, Google Slides
- Already on brand
- no formatting pass
Every point gets the slide it deserves.
A number belongs on a metrics slide. A sequence belongs on a process. Cheqq reads what each point is doing and shapes the slide around it, instead of pouring everything into the same bullet list.
- Statements, comparisons, processes, metrics, tables, charts and quotes
- The layout follows the content — you never fight a template to fit an idea
- Generated imagery is sized for the slot it sits in
- Every slide stays fully editable afterwards
Charts drawn natively, not pasted in.
Grouped and stacked bars, line, area, pie, doughnut, scatter and combo charts with secondary axes — rendered as real chart objects from the numbers in your collections.
- Bars, lines, areas, pies, scatter and combo charts with a secondary axis
- Plotted from your live collections, so the deck matches the system
- Re-generate the deck when the numbers move
- Schema-validated, so a chart can never reference data it does not have
It already looks like yours.
Your workspace brand kit — colour tokens, heading and body fonts, and logo — themes every slide as it is generated. No find-and-replace pass before you can send it.
- Primary, accent, background and foreground colours from your brand kit
- Your uploaded heading and body fonts, not a lookalike
- Your logo placed on the slides that call for it
- Validated against the kit, so nothing drifts off-brand
From prompt to deck
Describe it, or point at the data
Say what the deck is for and who it is for. Cheqq can pull the substance straight from your collections.
Cheqq builds the slides
It picks layouts per idea, draws the charts natively, and themes everything with your brand kit.
Edit, present, or export
Change anything by describing the change, then export a real .pptx — or publish it to a link.
Questions about slides
Is this a real PowerPoint file?
Yes — decks export as .pptx with native chart objects and real text boxes, so they open and edit normally in PowerPoint, Keynote and Google Slides. It is not a stack of images.
Can it use my company template?
It themes from your workspace brand kit — logo, colour tokens, uploaded font files and tone notes — which is applied to every slide it generates.
Where does the content come from?
From whatever you point it at: a prompt, a document, or the collections already in your workspace. Sourcing from your own data is the difference between a deck that looks right and one that is right.
Can a deck rebuild itself when the numbers change?
Yes. Generation can be a workflow step, so a scheduled trigger can rebuild the monthly deck from current data and email it out without you opening anything.
Works with the rest of the workspace
One prompt from a polished deck
Describe the presentation you need and let Cheqq build it. Free to start, no credit card.
Start free